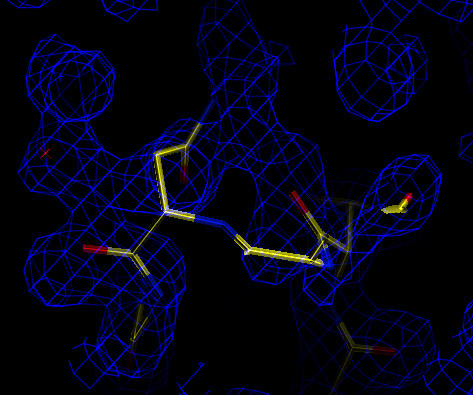
Incorrect conformation for loop at residue A200.
The model statistics are checked (as at the start of refinement) in order to check the model geometry and fit to the experimental diffraction data. In this example the CNS task file model_stats_final.inp is used to analyse the model geometry and diffraction statistics:
cns_solve < model_stats_final.inp > model_stats_final.out [2 minutes]
The output listing file (model_stats_final.list) contains a variety of information which is self-explanatory. Important things to note are:
R-values:
=================================== summary ==================================

resolution range: 500 - 1.8 A
  R-values:
    initial                                        r= 0.3157 free_r= 0.3124
    after B-factor and/or bulk solvent correction  r= 0.2568 free_r= 0.2812
R-values versus resolution:
================================= R-values ===================================


=======> R-values with |Fobs|/sigma cutoff= 0.0

 Test set (test = 1):

 #bin | resolution range | #refl |
    1   3.88  500.01        354      0.2481
    2   3.08    3.88        354      0.2798
    3   2.69    3.08        375      0.3010
    4   2.44    2.69        394      0.3350
    5   2.27    2.44        349      0.2734
    6   2.13    2.27        384      0.2835
    7   2.03    2.13        349      0.2864
    8   1.94    2.03        348      0.2784
    9   1.86    1.94        374      0.2577
   10   1.80    1.86        393      0.2865

 Working set:

 #bin | resolution range | #refl |
    1   3.88  500.01       3463      0.2479
    2   3.08    3.88       3468      0.2605
    3   2.69    3.08       3422      0.2829
    4   2.44    2.69       3431      0.2775
    5   2.27    2.44       3444      0.2655
    6   2.13    2.27       3416      0.2375
    7   2.03    2.13       3438      0.2412
    8   1.94    2.03       3443      0.2381
    9   1.86    1.94       3400      0.2468
   10   1.80    1.86       3323      0.2535
This distribution of R-values is reasonable - there is no dramatic increase in R-value (in particular free R-value) as resolution increases. If there were resolution shells with R-values significantly higher than the rest this might indicate possible problems with the data processing (ice rings for example). However, the R-values indicate the fit to the experimental data and should not be manipulated by removing data - in particular by the use of sigma cutoffs to exclude weak data.
The overall geometry:
rmsd bonds= 0.005513 with 0 bond violations > 0.05
rmsd angles=  1.20416 with 3 angle violations >  8.0
rmsd dihedrals= 23.30213 with 0 angle violations >  60.0
rmsd improper=  0.81570 with 7 angle violations >  3.0
These overall statistics look very good. It is worth checking the outlying angle and improper deviations in the detailed geometry analysis (below).
The geometry in detail:
================================= geometry ===================================

=======> bond violations

 (atom-i        |atom-j        )    dist.   equil.   delta    energy   const.


=======> angle violations

 (atom-i        |atom-j        |atom-k        )  angle    equil.     delta    energy  const.

 (A    198  N   |A    198  CA  |A    198  C   )   99.687  111.200  -11.513   10.009  247.886
 (B    182  N   |B    182  CA  |B    182  C   )  101.078  111.200  -10.122    7.737  247.886
 (B    198  N   |B    198  CA  |B    198  C   )  102.638  111.200   -8.562    5.536  247.886

=======> improper angle violations

 (atom-i        |atom-j        |atom-k        |atom-L        )    angle    equil.   delta    energy   const.   period

 (A    120  N   |A    120  CA  |A    120  CD  |A    119  C   )   -3.715    0.000    3.715    0.420  100.000   0
 (A    138  N   |A    138  CA  |A    138  CD  |A    137  C   )   -7.291    0.000    7.291    1.620  100.000   0
 (A    168  CG  |A    168  CD1 |A    168  CD2 |A    168  CB  )    3.727    0.000   -3.727    3.174  750.000   0
 (A    206  CA  |A    206  N   |A    206  C   |A    206  CB  )   32.042   35.264    3.222    2.372  750.000   0
 (B    120  N   |B    120  CA  |B    120  CD  |B    119  C   )   -4.042    0.000    4.042    0.498  100.000   0
 (B    138  N   |B    138  CA  |B    138  CD  |B    137  C   )   -5.320    0.000    5.320    0.862  100.000   0
 (B    161  CA  |B    161  N   |B    161  C   |B    161  CB  )   32.220   35.264    3.044    2.117  750.000   0

=======> dihedral angle violations

 (atom-i        |atom-j        |atom-k        |atom-L        )    angle    equil.   delta    energy   const.   period
Specific problems with the model geometry can be identified here. The angle deviation all occur at N-CA-C angles. Based on high resolution structures this angle is flexible, so small deviations for some of these angles are tolerated.
After analysis of the geometry and fit to the experimental data electron density maps should be checked. Cross-validated, sigma-A weighted 2Fo-Fc and difference maps are calculated:
      cns_solve < model_map_final_1fofc.inp > model_map_final_1fofc.out [30 seconds]
      cns_solve < model_map_final_2fofc.inp > model_map_final_2fofc.out [1 minute]
If you have mapman installed, you can use the command
map_to_omap *.map
to convert the CNS maps to a format which can be read into
O. In O, enter @omac to read in the current
model and map.
Analysis of the difference map shows that some ordered water molecules are still missing (not shown). These can be placed either manually or by further rounds of automated water picking. Analysis of the 2Fo-Fc map indicates a loop in both molecules that is incorrectly placed. This can be manually rebuilt and further refinement carried out:
 |
| Cross-validated Sigma-A weighted 2Fo-Fc map (at 1.5 sigma). Incorrect conformation for loop at residue A200. |