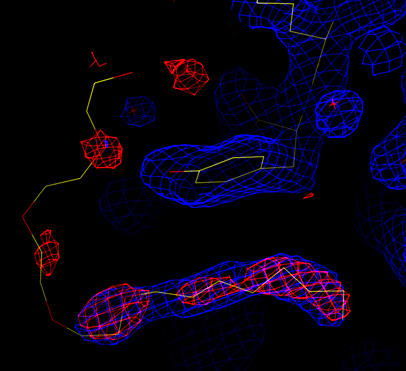
Gradient map in red (3 sigma).
The coordinates for the wild-type structure (1prn) are shown.
Density is seen for a lipid/detergent molecule (also seen in 7prn).
The model statistics are checked (as at the start of refinement) in order to check the model geometry and fit to the experimental diffraction data. In this example the CNS task file model_stats_twin_final.inp is used to analyse the model geometry and diffraction statistics:
cns_solve < model_stats_twin_final.inp > model_stats_twin_final.out [2 minutes]
The output listing file (model_stats_twin_final.list) contains a variety of information which is self-explanatory. Important things to note are:
R-values:
=================================== summary ==================================

resolution range: 500.0 - 2.25 A
  Twinned R-values:
  initial                                        r= 0.2866 free_r= 0.2467
  after B-factor and/or bulk solvent correction  r= 0.1425 free_r= 0.1847
R-values versus resolution:
============================= twinned R-values ===============================


=======> R-values with |Fobs|/sigma cutoff= 0.0

 Test set (test = 1):

 #bin | resolution range | #refl |
    1   4.85  500.01        196      0.1743
    2   3.85    4.85        187      0.1611
    3   3.36    3.85        217      0.1649
    4   3.05    3.36        211      0.1822
    5   2.83    3.05        223      0.1838
    6   2.67    2.83        239      0.2054
    7   2.53    2.67        233      0.2191
    8   2.42    2.53        215      0.2189
    9   2.33    2.42        242      0.2103
   10   2.25    2.33        232      0.2169

 Working set:

 #bin | resolution range | #refl |
    1   4.85  500.01       2128      0.1347
    2   3.85    4.85       2179      0.1118
    3   3.36    3.85       2188      0.1148
    4   3.05    3.36       2188      0.1320
    5   2.83    3.05       2153      0.1562
    6   2.67    2.83       2192      0.1667
    7   2.53    2.67       2132      0.1790
    8   2.42    2.53       2179      0.1914
    9   2.33    2.42       2182      0.2014
   10   2.25    2.33       2174      0.1943
This distribution of R-values is reasonable - there is no dramatic increase in R-value (in particular free R-value) as resolution increases. If there were resolution shells with R-values significantly higher than the rest this might indicate possible problems with the data processing (ice rings for example). However, the R-values indicate the fit to the experimental data and should not be manipulated by removing data - in particular by the use of sigma cutoffs to exclude weak data.
The overall geometry:
rmsd bonds= 0.008428 with 2 bond violations > 0.05
rmsd angles=  1.37251 with 9 angle violations >  8.0
rmsd dihedrals= 27.05995 with 0 angle violations >  60.0
rmsd improper=  0.65454 with 3 angle violations >  3.0
These overall statistics look very good. It is worth checking the outlying angle and improper deviations in the detailed geometry analysis (below).
The geometry in detail:
================================= geometry ===================================

=======> bond violations

 (atom-i        |atom-j        )    dist.   equil.   delta    energy   const.

 (A    1    CG  |A    1    SD  )    1.858    1.803    0.055    1.533  512.111
 (A    1    SD  |A    1    CE  )    1.871    1.791    0.080    1.093  170.066

=======> angle violations

 (atom-i        |atom-j        |atom-k        )  angle    equil.     delta    energy  const.

 (A    8    N   |A    8    CA  |A    8    C   )  103.275  112.500   -9.225    5.991  231.085
 (A    86   N   |A    86   CA  |A    86   C   )  102.880  111.200   -8.320    5.227  247.886
 (A    91   N   |A    91   CA  |A    91   C   )  121.715  111.200   10.515    8.349  247.886
 (A    196  N   |A    196  CA  |A    196  C   )  101.624  111.200   -9.576    6.925  247.886
 (A    201  N   |A    201  CA  |A    201  C   )  102.670  111.200   -8.530    5.495  247.886
 (A    214  N   |A    214  CA  |A    214  C   )   98.559  111.200  -12.641   12.066  247.886
 (A    215  N   |A    215  CA  |A    215  C   )  120.040  111.200    8.840    5.901  247.886
 (A    241  N   |A    241  CA  |A    241  C   )  100.631  111.200  -10.569    8.435  247.886
 (A    271  N   |A    271  CA  |A    271  C   )  101.996  111.200   -9.204    6.397  247.886

=======> improper angle violations

 (atom-i        |atom-j        |atom-k        |atom-L        )    angle    equil.   delta    energy   const.   period

 (A    55   CG  |A    55   CD1 |A    55   CD2 |A    55   CB  )    3.244    0.000   -3.244    2.404  750.000   0
 (A    102  CA  |A    102  N   |A    102  C   |A    102  CB  )   32.058   35.264    3.206    2.349  750.000   0
 (A    259  CG  |A    259  CD1 |A    259  CD2 |A    259  CB  )    3.194    0.000   -3.194    2.331  750.000   0

=======> dihedral angle violations

 (atom-i        |atom-j        |atom-k        |atom-L        )    angle    equil.   delta    energy   const.   period
Specific problems with the model geometry can be identified here. The angle deviation all occur at N-CA-C angles. Based on high resolution structures this angle is flexible, so small deviations for some of these angles are tolerated.
Non-trans peptide bonds:
============================ non-trans peptides ==============================

there are no distorted or cis- peptide planes
The presence of non-trans peptides, unless they are proline residues, will cause problems in refinement. They can be identified, and an appropriate parameter file created using the CNS task file general/cis_peptide.inp. The parameter file generated is read into subsequent refinement task files.
Statistics about detwinning of the data:
================================ detwinning ==================================

data detwinned with: F_detwin   = (Fo^2 - alpha*[Fo^2 + Fo'^2])/(1 - 2*alpha)
                     Fo'[h,k,l] = Fo[h,-h-k,-l]
                     alpha      = 0.304

reflections rejected (I_detwin <= 0): 683
                         working set: 626
                            test set: 57
The detwinning algorithm depends on whether the twinning is perfect or partial. Some reflections are rejected during the detwinning procedure because the resultant intensity is less than zero.
Detwinned R-values:
============================ detwinned R-values ==============================

resolution range: 500.0 - 2.25 A
  R-values:
  after detwinning  r= 0.2060 free_r= 0.2523
The R-values after detwinning are in greater in magnitude than the twinned R-values.
After analysis of the geometry and fit to the experimental data electron density maps should be checked. Cross-validated, sigma-A weighted 2Fo-Fc and gradient maps are calculated:
      cns_solve < model_map_twin_final_grad.inp > model_map_twin_final_grad.out [1 minute]
      cns_solve < model_map_twin_final_2fofc.inp > model_map_twin_final_2fofc.out [1 minute]
If you have mapman installed, you can use the command
map_to_omap *.map
to convert the CNS maps to a format which can be read into
O. In O, enter @omac to read in the current
model and map.
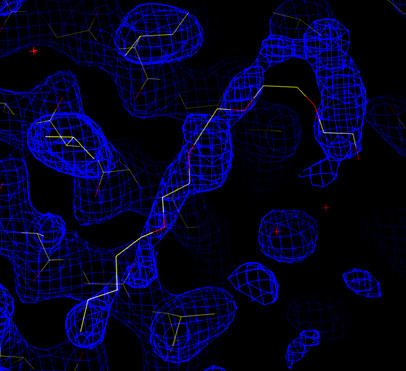
Analysis of the gradient map and cross-validated sigma-A weighted 2Fo-Fc map shows that an ordered water molecule is still missing (not shown). Also, there is electron density in the regions where a lipid/detergent molecule was identified in the original structure refined without twinning (7prn), and a lipid/detergent molecule seen in the wild-type structure (1prn):
 |
| Cross-validated Sigma-A weighted 2Fo-Fc map in blue (at 1.5 sigma). Gradient map in red (3 sigma). The coordinates for the wild-type structure (1prn) are shown. Density is seen for a lipid/detergent molecule (also seen in 7prn). |
 |
| Cross-validated Sigma-A weighted 2Fo-Fc map in blue (at 1.0 sigma). The coordinates for the wild-type structure (1prn) are shown. Putative density for a lipid/detergent molecule. |