|
[filename].PMS
A table of fraction of simulation ensemble that each residue spends in each mesostate.
(Only 4 of the possible 37 mesostates are shown here).
Mesostate   *         A        ....    q         r
   1 MET   0.00e+00  0.00e+00  ....   0.00e+00  0.00e+00
   2 THR   0.00e+00  0.00e+00  ....   0.00e+00  0.00e+00
   3 TYR   0.00e+00  0.00e+00  ....   5.38e-01  0.00e+00
   4 LYS   0.00e+00  0.00e+00  ....   0.00e+00  0.00e+00
   5 LEU   0.00e+00  0.00e+00  ....   4.95e-01  0.00e+00
   6 ILE   0.00e+00  0.00e+00  ....   0.00e+00  0.00e+00
   7 LEU   0.00e+00  0.00e+00  ....   2.00e-01  0.00e+00
   8 ASN   0.00e+00  0.00e+00  ....   1.60e-02  0.00e+00
   9 GLY   0.00e+00  1.00e-02  ....   0.00e+00  0.00e+00
  10 LYS   0.00e+00  0.00e+00  ....   0.00e+00  0.00e+00

This table is 39 columns wide. A plot of the data in the table enables one to better see which mesostates are being sampled with greatest probability.
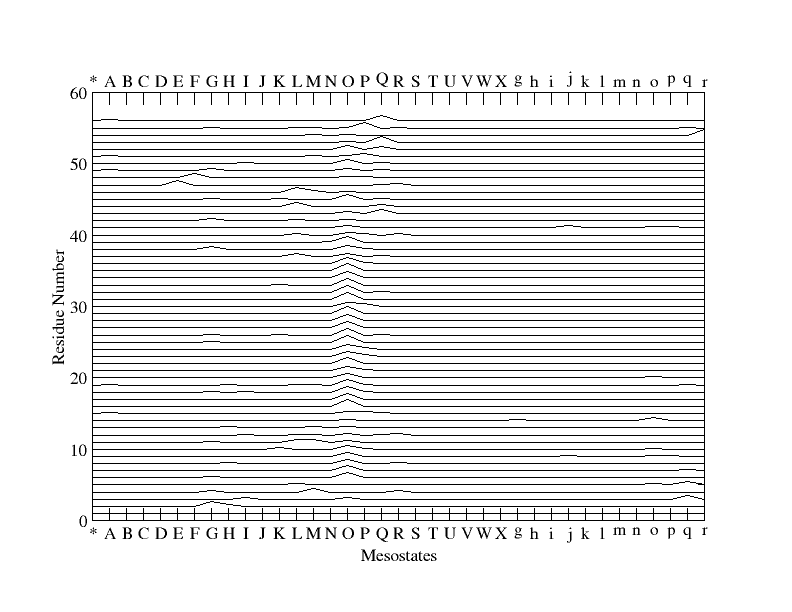 This plot shows that many of the residues (especially 17-35) were conformationally in mesostate "O" for much of the simulation,
and that residues 3 and 5 sample mesostate "q" with high probability (also seen in the table above).
The plot can be made by entering the following commands while in your simulation output directory
(assuming you have xmgrace installed).
The file name, "b1_018_001" will be different in your particular simulation.
This plot shows that many of the residues (especially 17-35) were conformationally in mesostate "O" for much of the simulation,
and that residues 3 and 5 sample mesostate "q" with high probability (also seen in the table above).
The plot can be made by entering the following commands while in your simulation output directory
(assuming you have xmgrace installed).
The file name, "b1_018_001" will be different in your particular simulation.
cp $LINUS/utils/transpose_PMS.awk .
cp $LINUS/utils/xmgrace_pmeso.par .
awk -f transpose_PMS.awk b1_018_001.PMS > pmeso.dat
xmgrace pmeso.dat &
Then in the xmgrace menus click the following,
Plot | Load parameters | xmgrace_pmeso.par
An alternative way to view pms files is to use meso_comp.py. This makes colored plots of mesostate sampling for each
residue in the pms file and saves them as postscripts. A new file is made for every 50 residues.
meso_comp.py [-h] -i <filename> [options]
This program plots densities of mesostate sampling for each residue in a
protein.  There are 50 residues in each plot.
Inputs:
           o  -i  name of the input PMS file
           o  -o  name of files to be saved
                  if no name is specified, the name of the input file
                  is used by default
           o  -h  help

Outputs:
           o  Plots in .ps format.  Note, if there are more than 50 residues in
           the PMS file, multiple files will be saved.
Example:

          meso_comp.py -i foo.pms -o bar
          If foo.pms has 100 residues, the program will make 2 files:
          bar_1.ps and bar_2.ps
| 